Chrome dev tools is a suite of tools that, we web developers, can use on our daily basis to prototype, analyze and debug our Javascript, CSS, and HTML code.
In this post, I’ll introduce you to some of the most interesting and lesser-known Chrome DevTools Features that you might find useful.
Jump to headingGetting started
You can open up your browser DevTools by pressing Ctrl + Shift + I (Windows) or Cmd + Option + I (Mac)
Note: Some of the features are available only on Chrome 85+
Jump to headingRendering
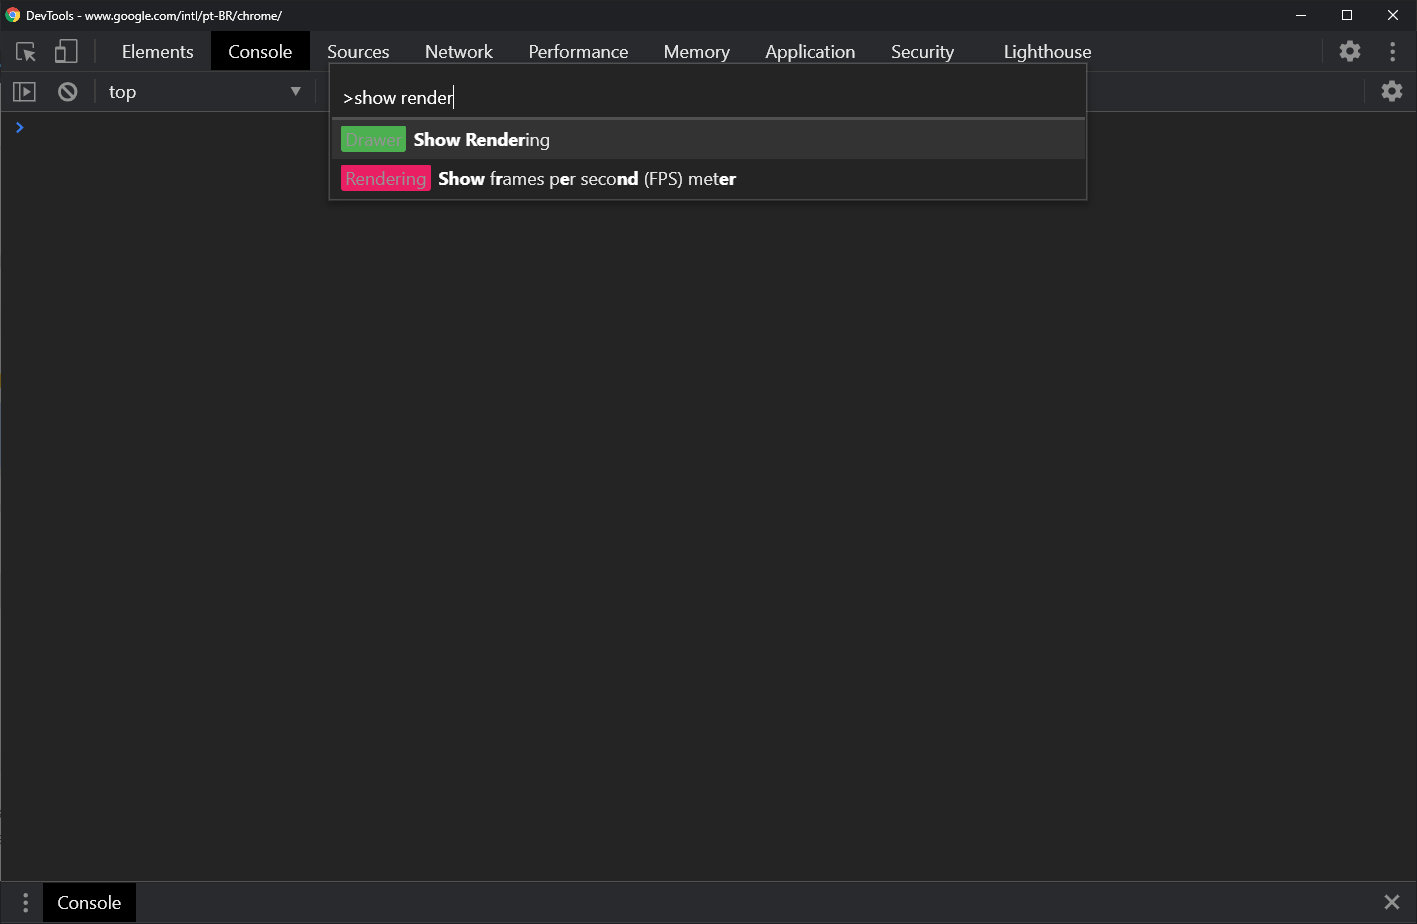
By default this tab is hidden, however, you can enable it by pressing Cmd/Ctrl + Shift + P and type “Show Rendering”. This feature provides you a series of options to visualize your page’s rendering performance.
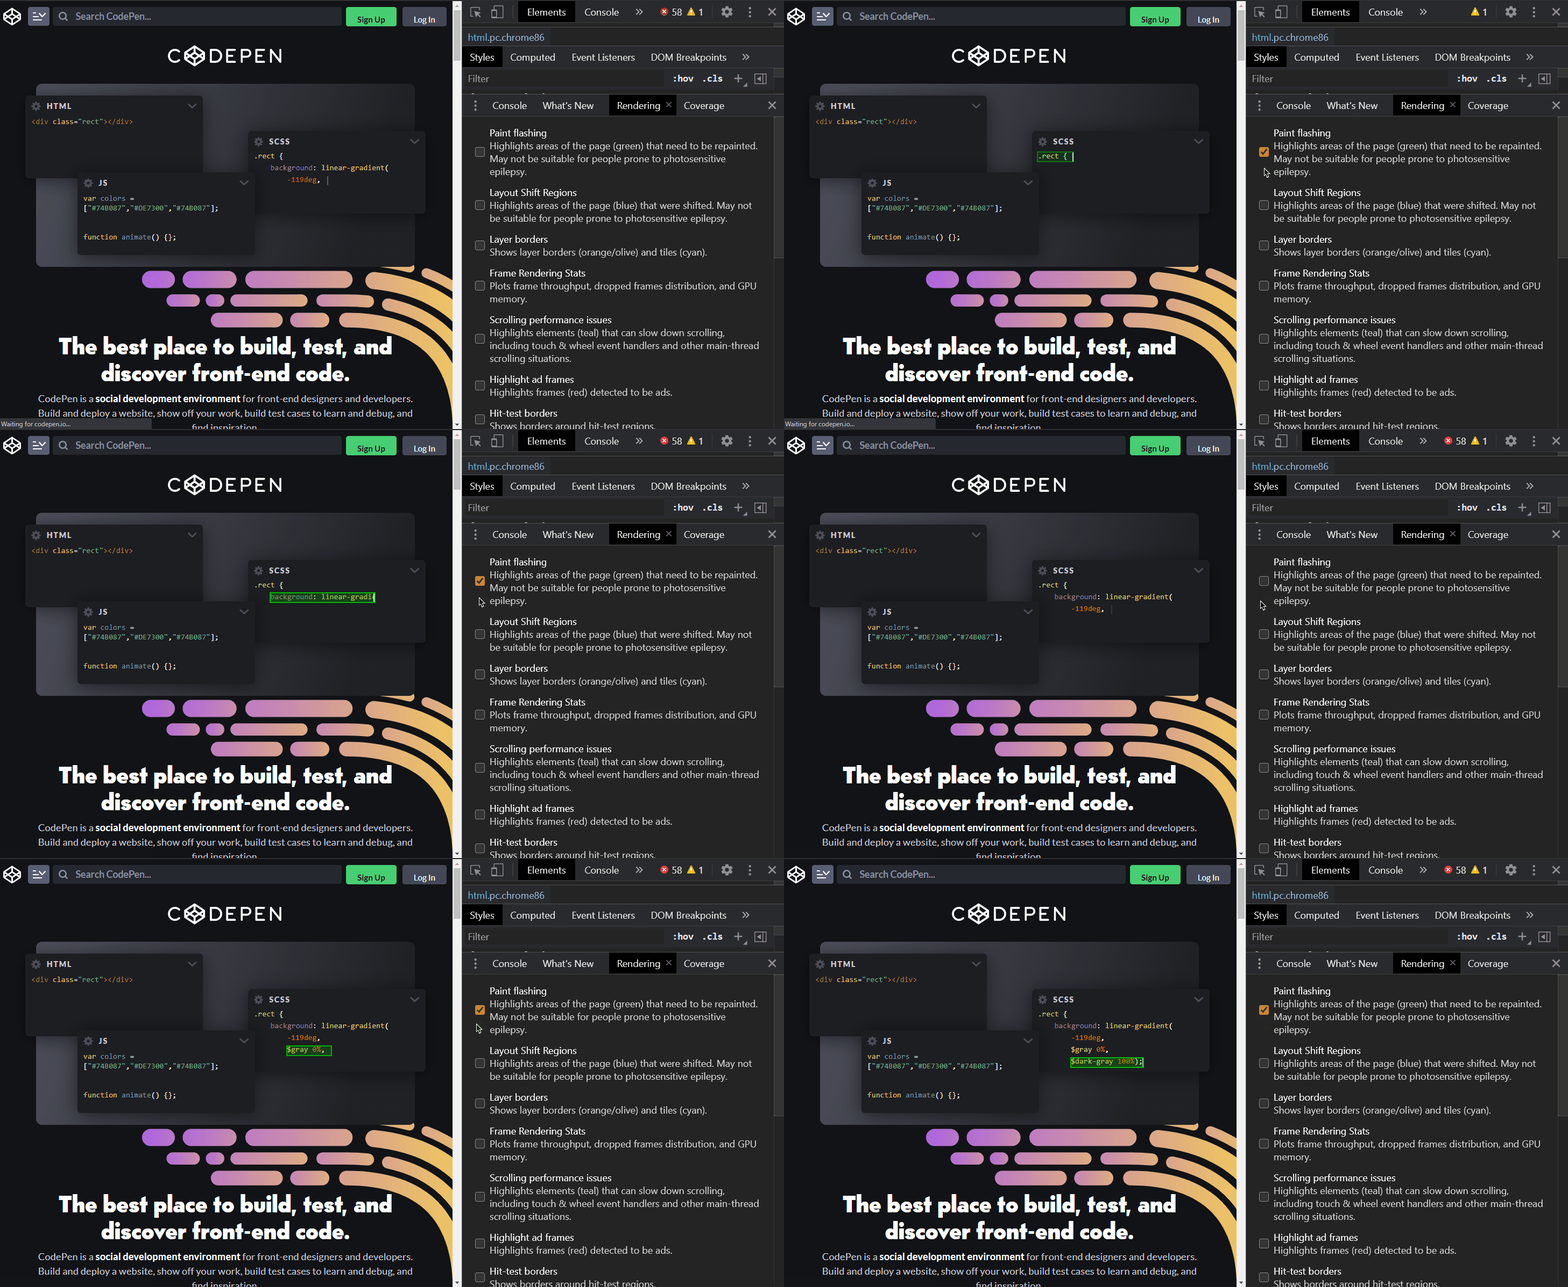
Paint Flashing option gives you the ability to visualize when something is repainted on the screen.
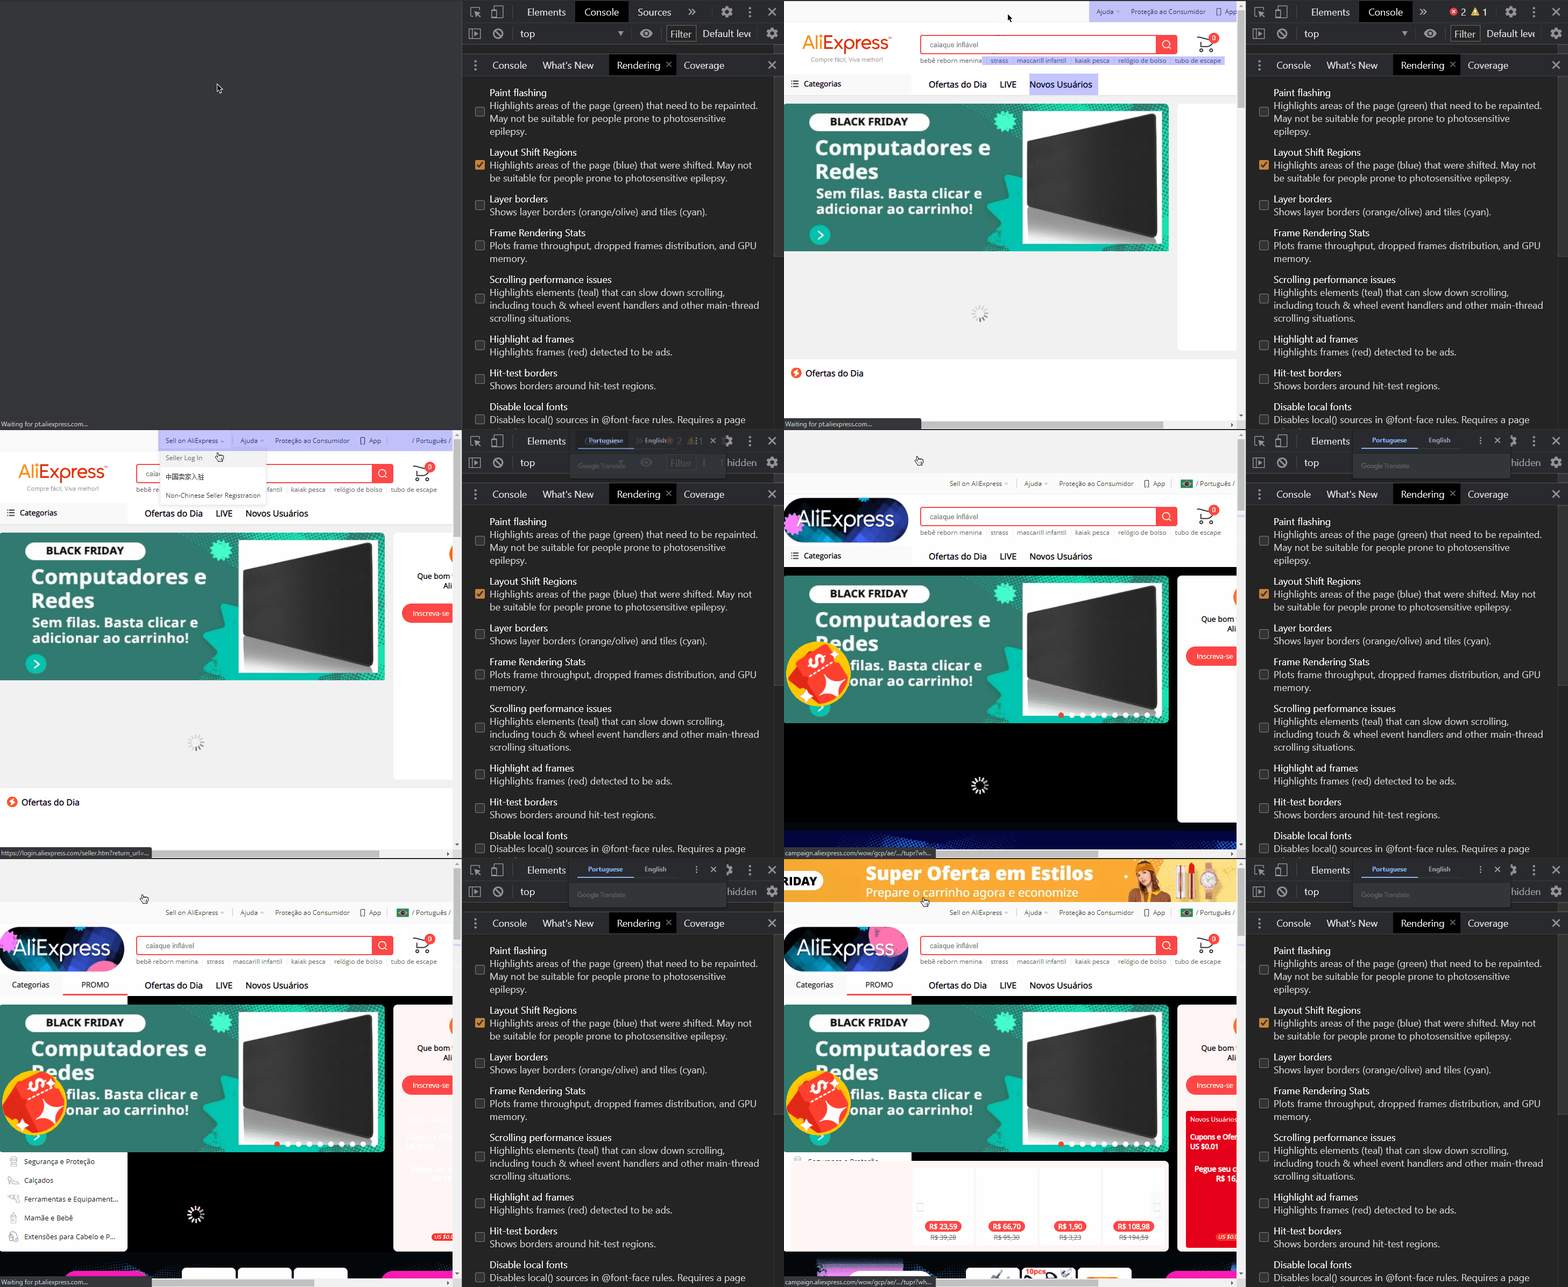
Layout shift shows you which areas of your page (highlighted blue) are being shifted at any point in time. A layout shift occurs when a visible element on your page changes position or size, affecting the position of content around it.
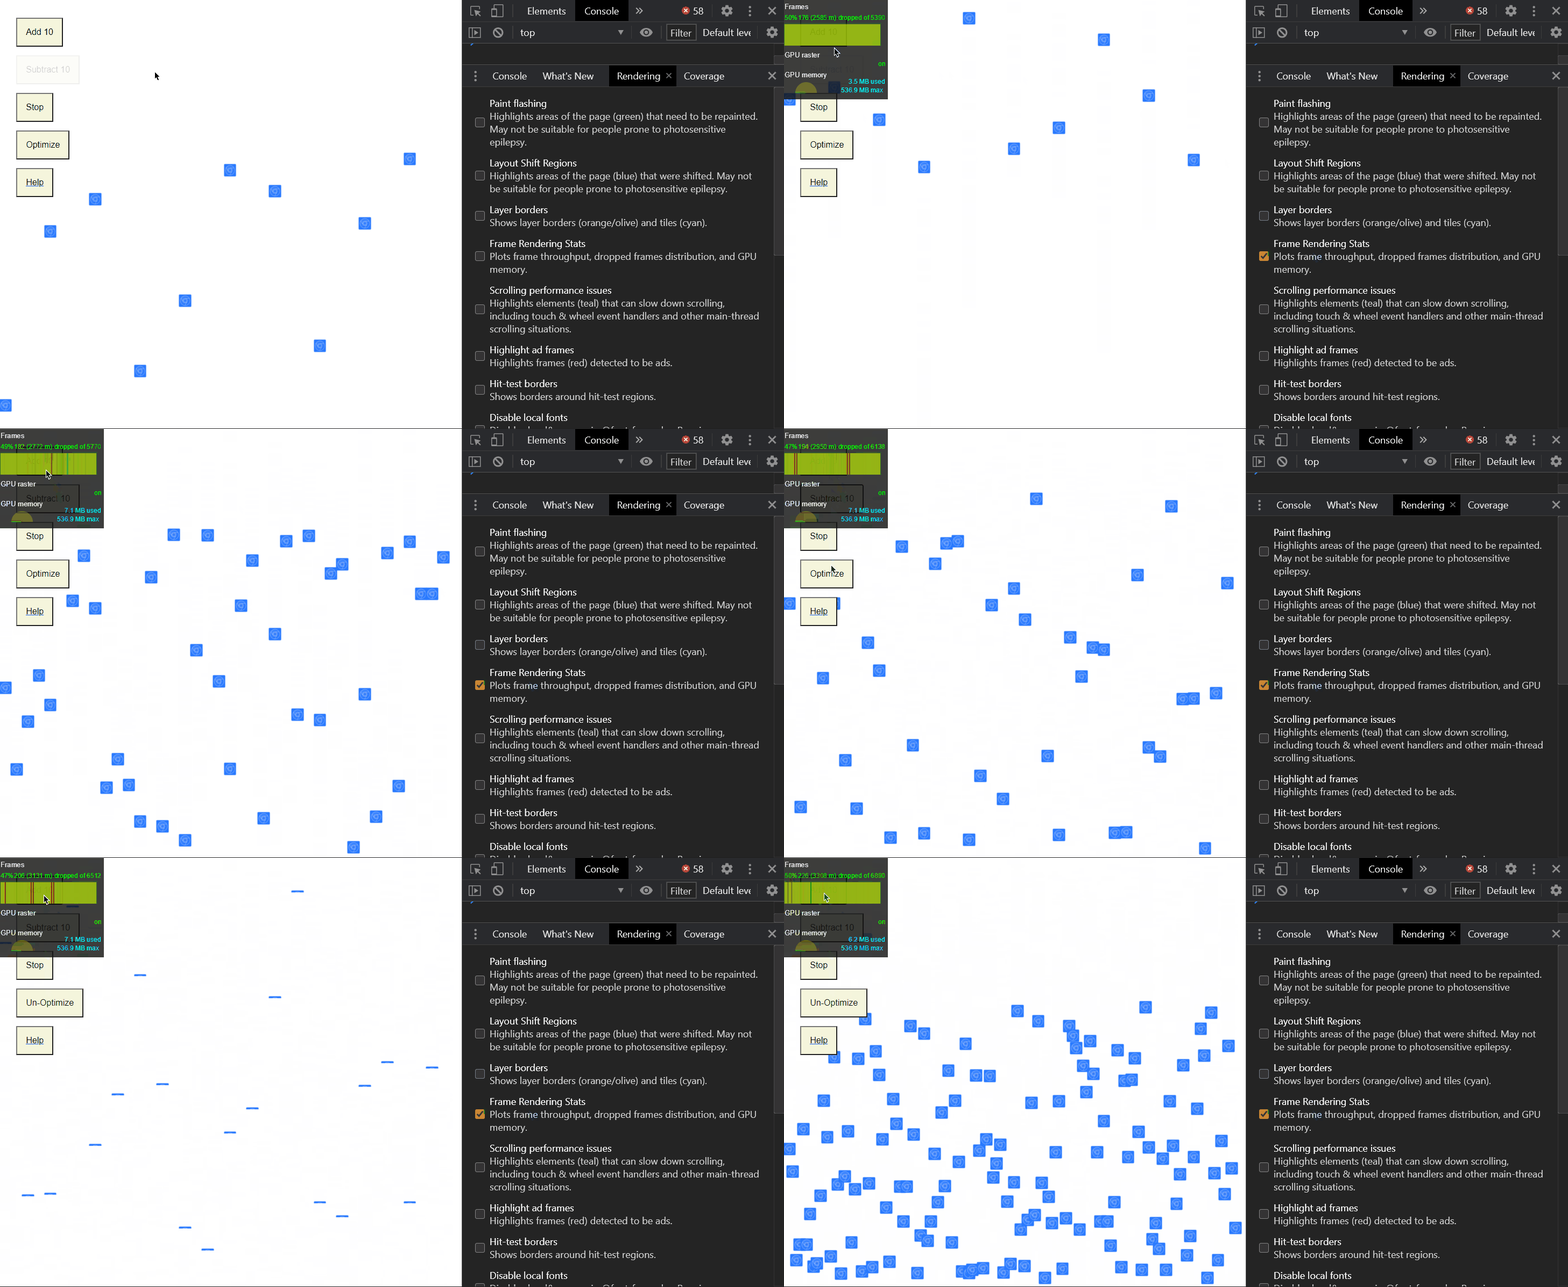
Frame rendering stats display frames per second and GPU usage in realtime on your current page.
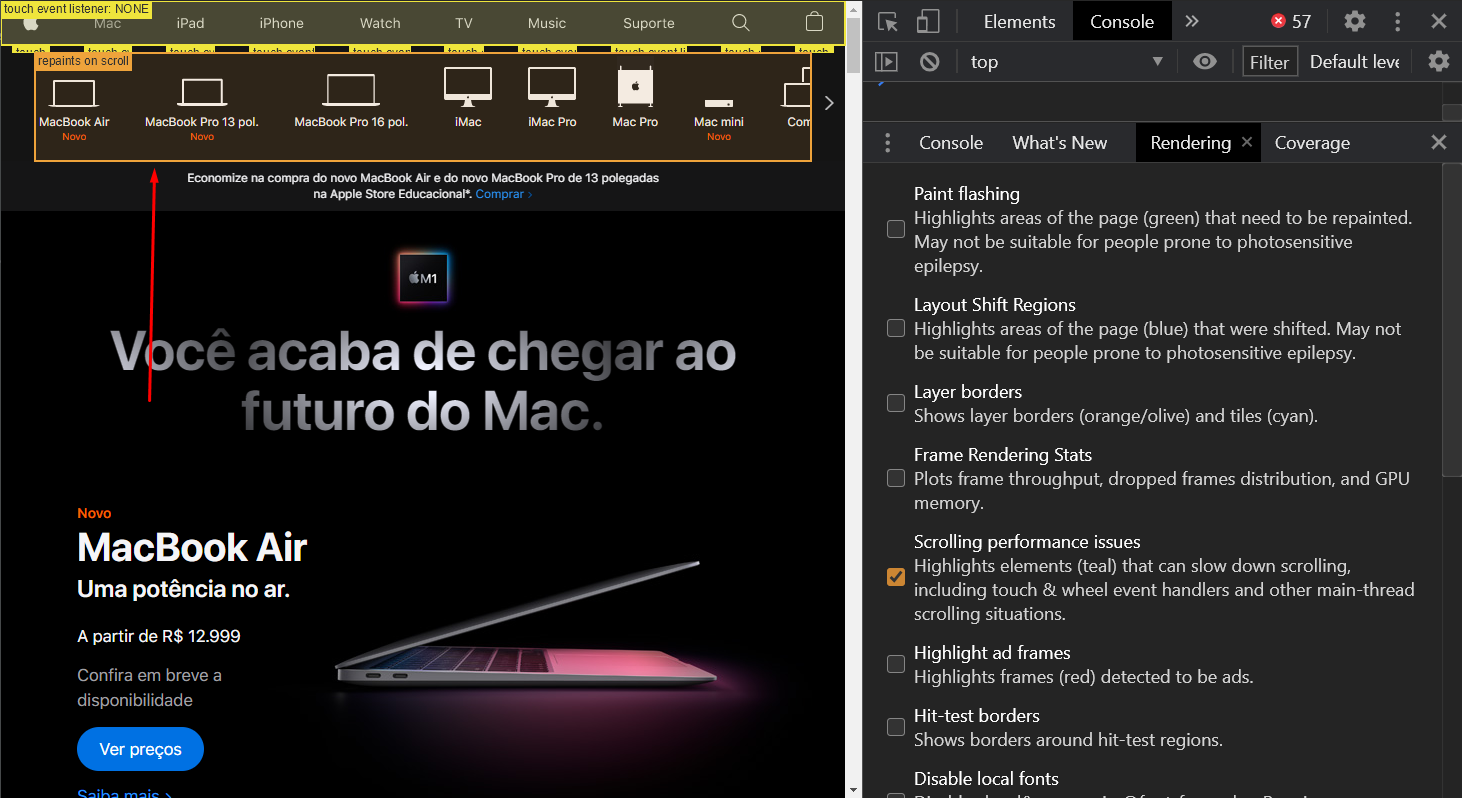
Scrolling performance issues option highlights elements that can slow down your page scrolling.
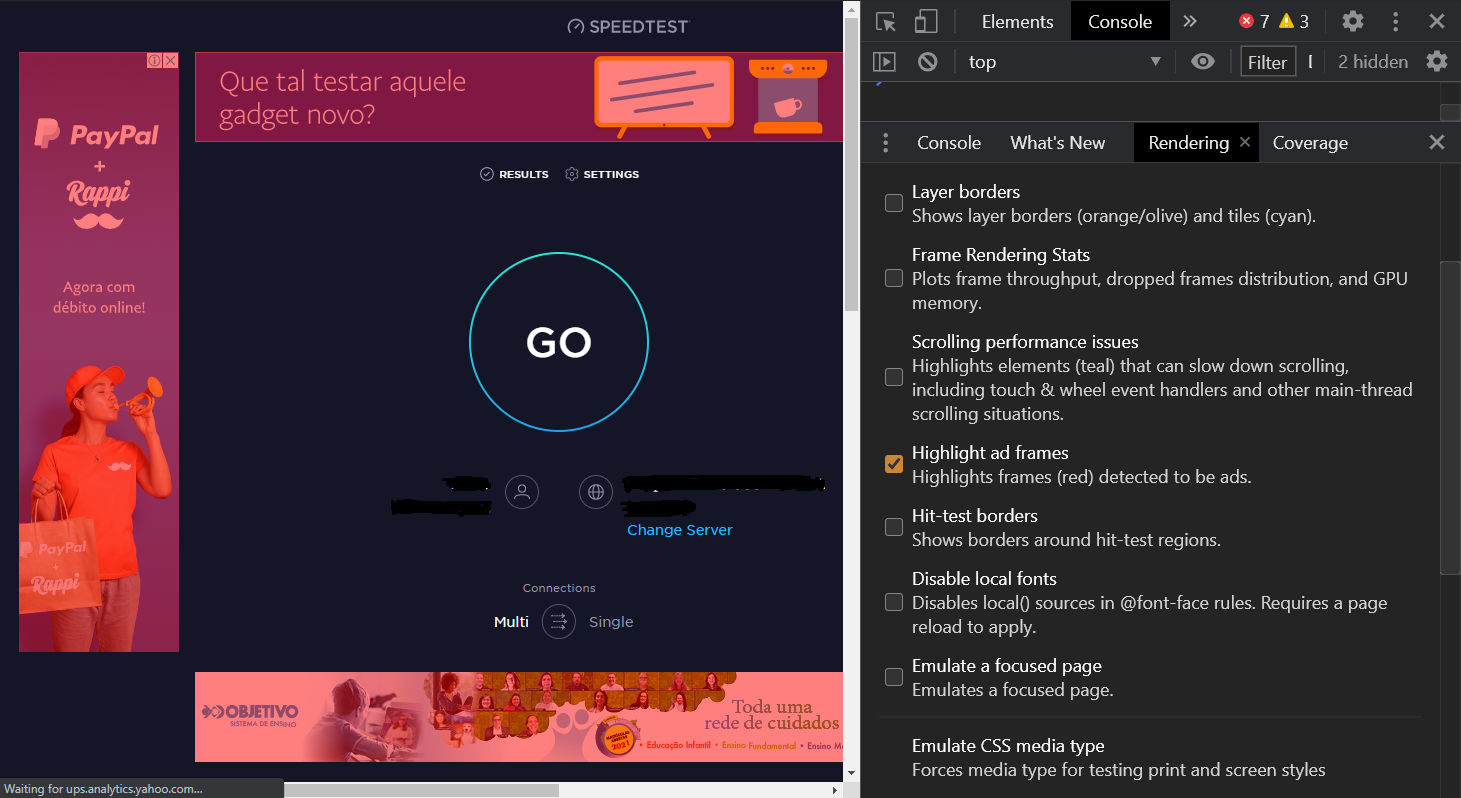
Highlight ad frames option shows all ad frames present on your website
Jump to headingCSS Media Features
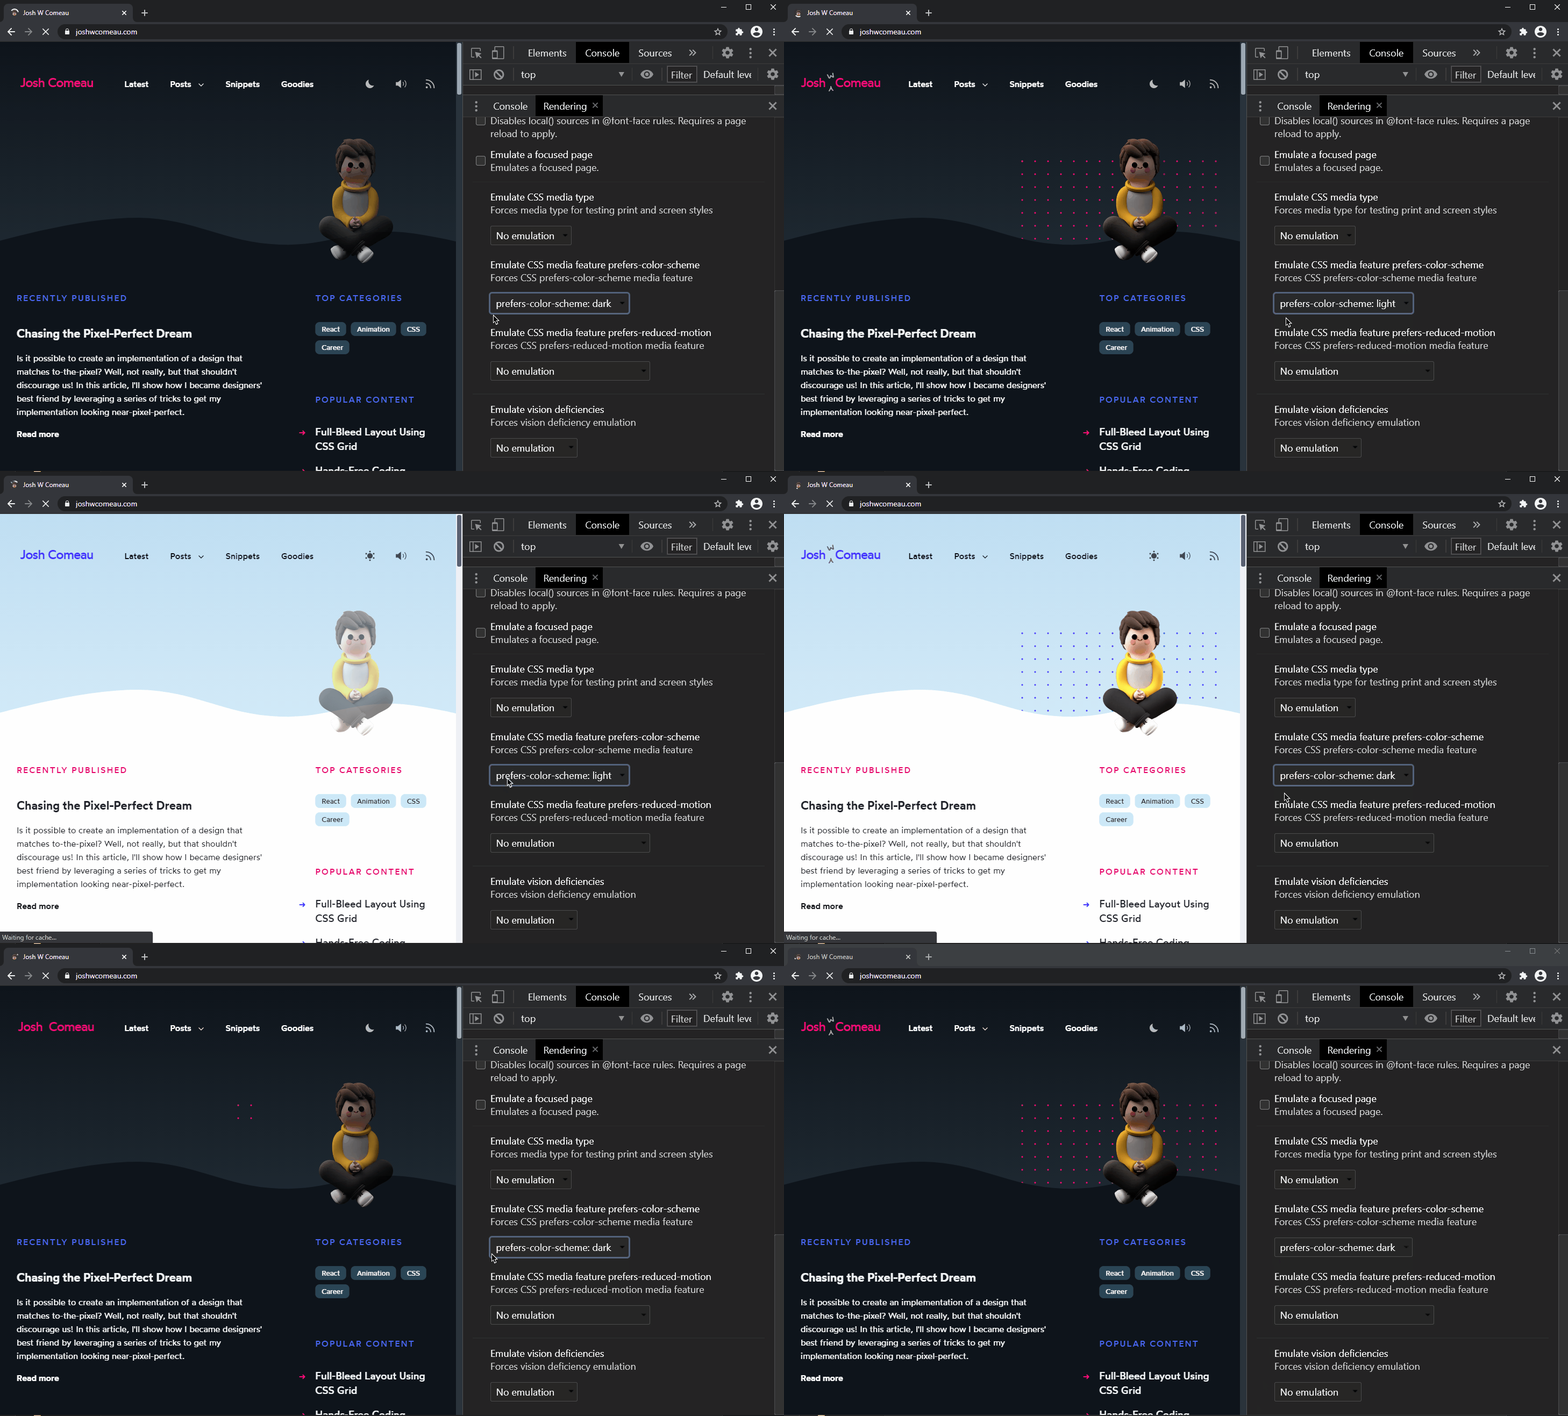
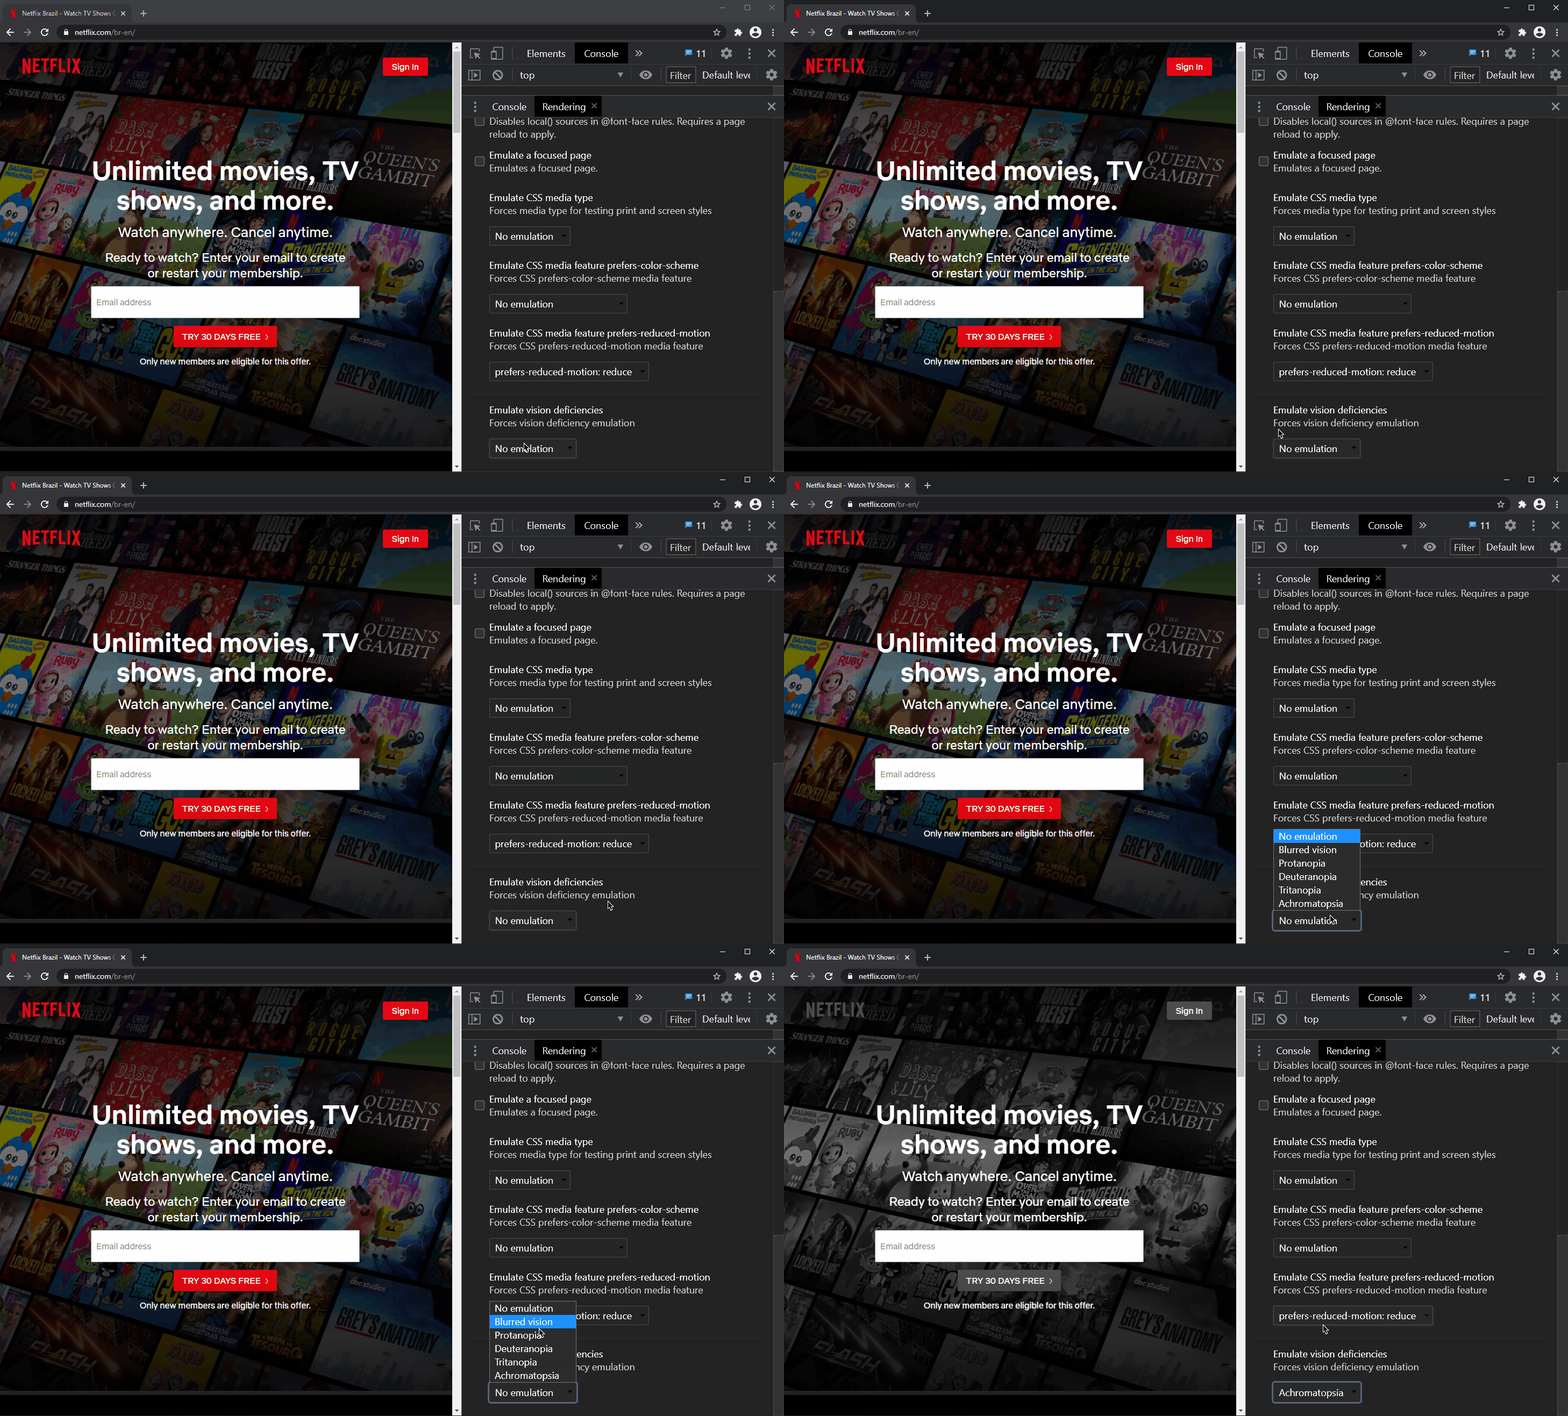
Emulate CSS prefers-color-scheme prefers-color-scheme allows us to set a system theme preference for interfaces like light or dark mode
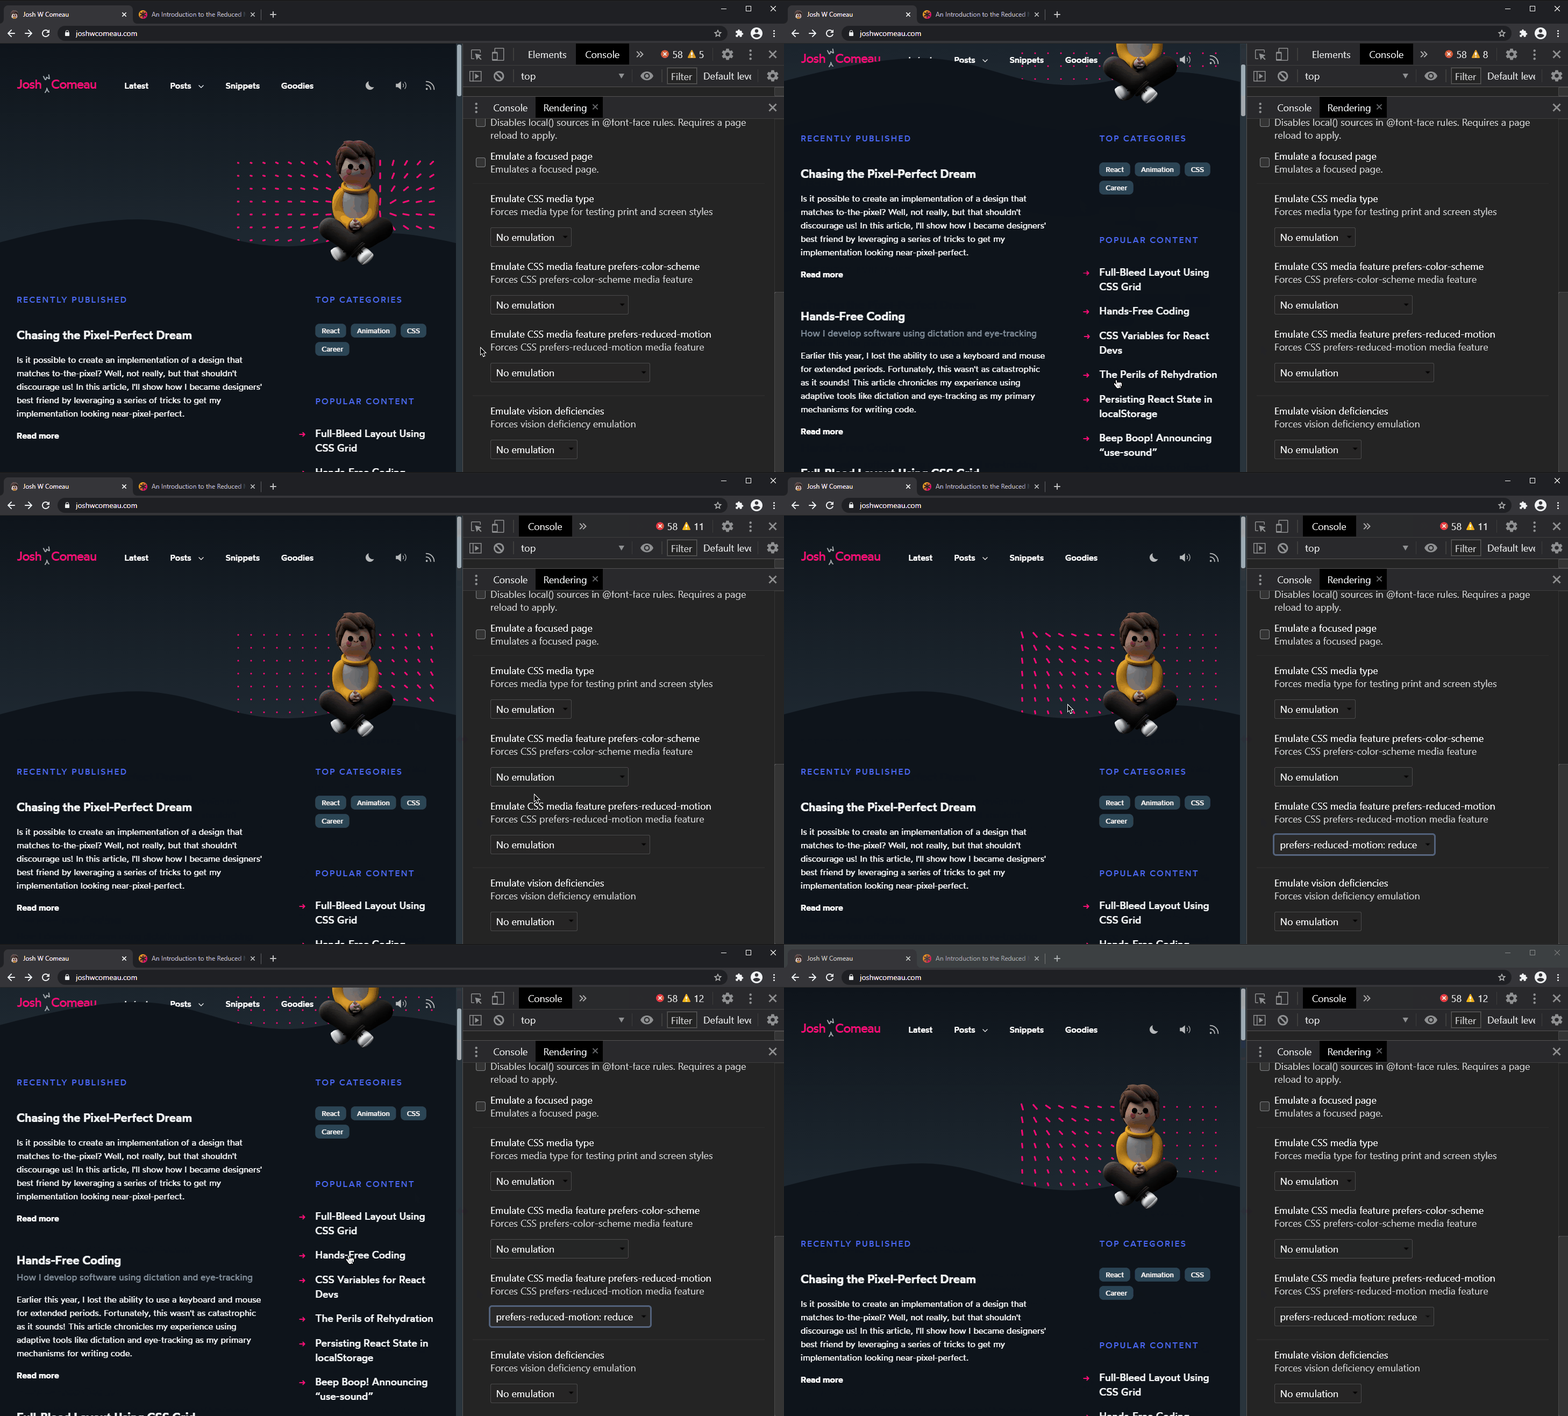
Emulate CSS prefers-reduced-motion prefers-reduced-motion can set a preference to minimize the amount of animation or motion a website uses.
Emulate vision deficiency is a nice accessibility option to simulate color vision deficiencies in realtime on your current page. This feature can give us a better understanding of how people with different types of vision deficiencies experience our website
Jump to headingCSS Overview
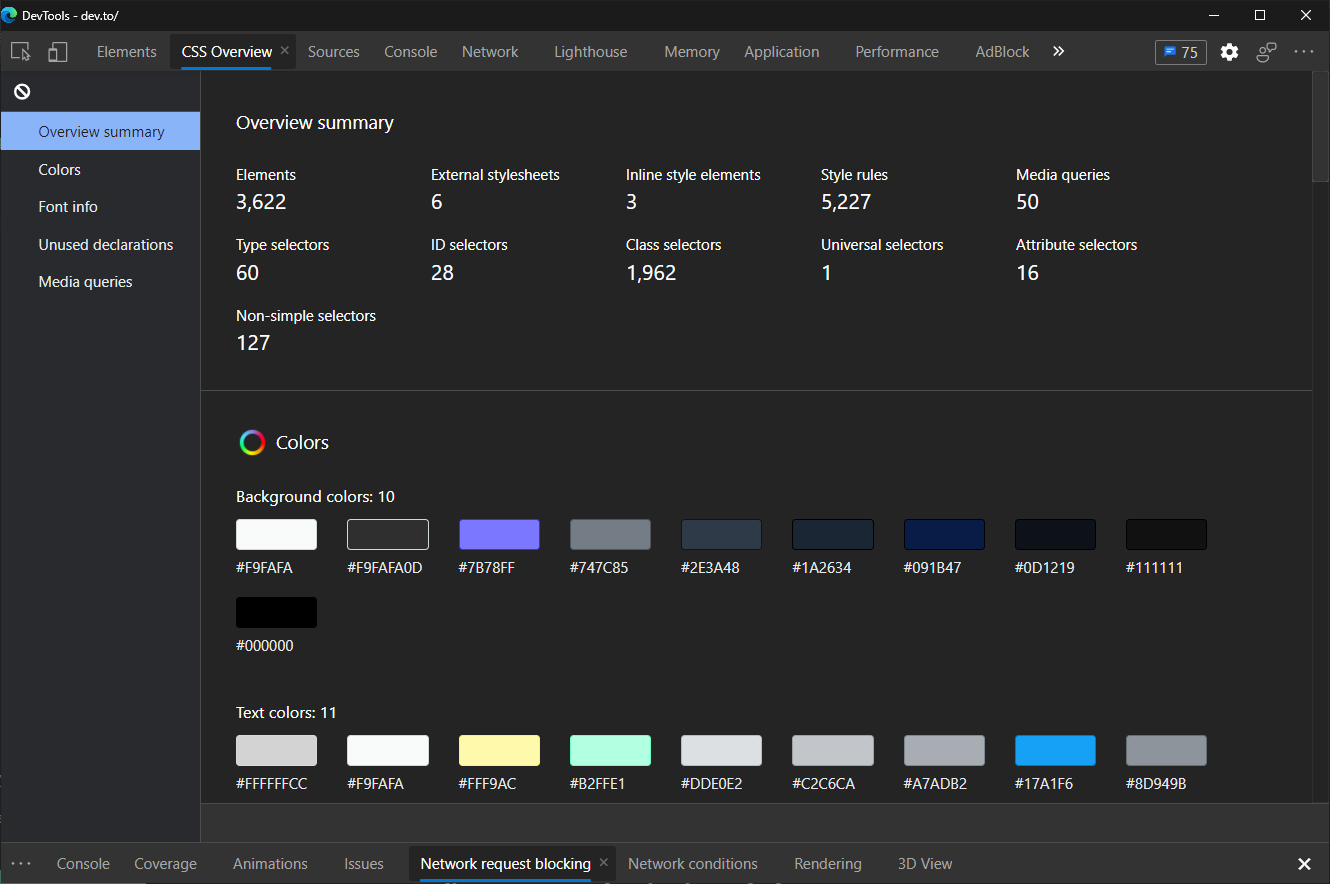
CSS Overview is a quite new and experimental tool present on newer versions of chrome that enables to take a quick overview of what colors and fonts a website use as well as unused properties, declarations, and even how many media queries are being used.
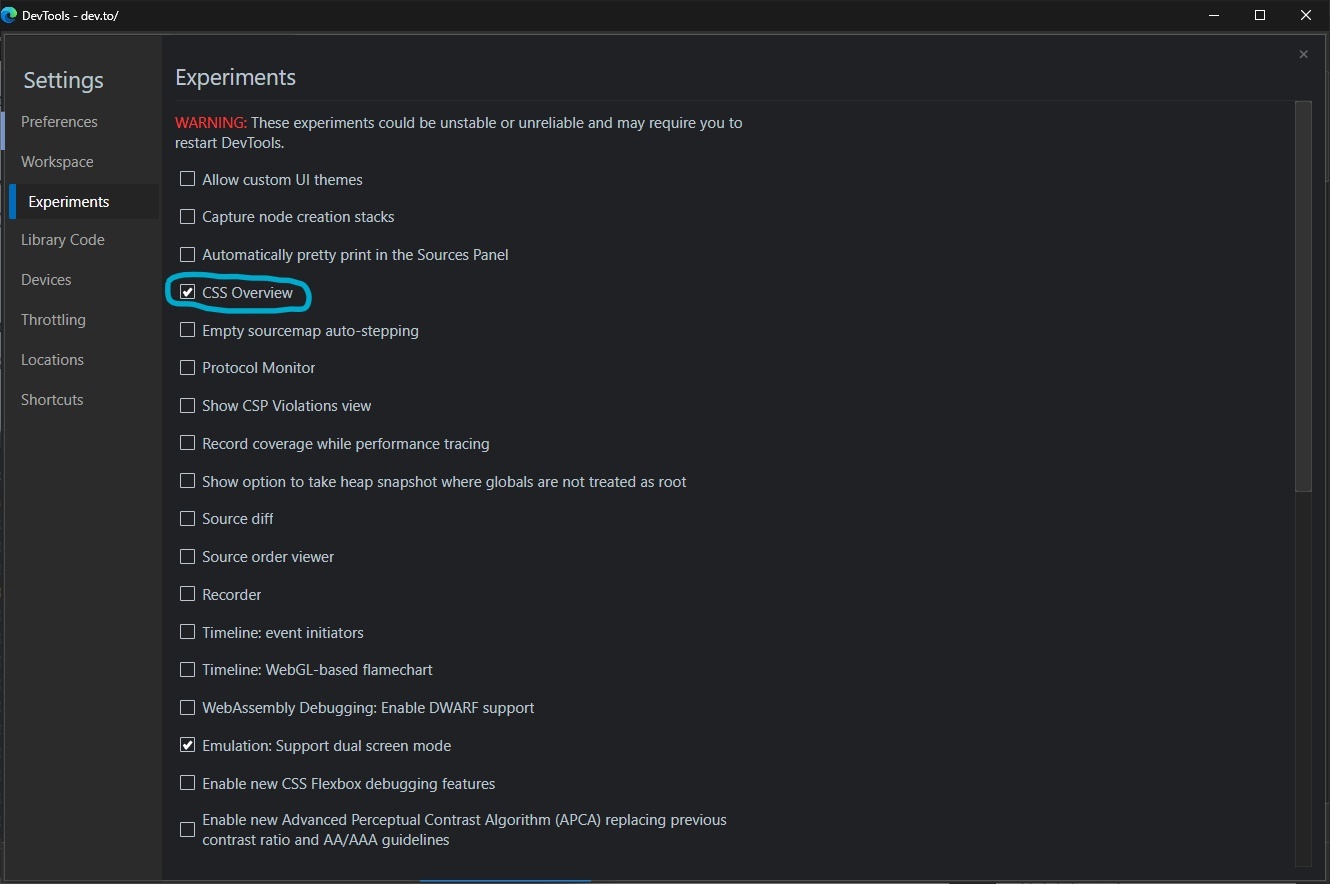
Open with CTRL + SHIFT + P and type Show CSS Overview and then we click on “Capture overview”
Jump to headingAnimations
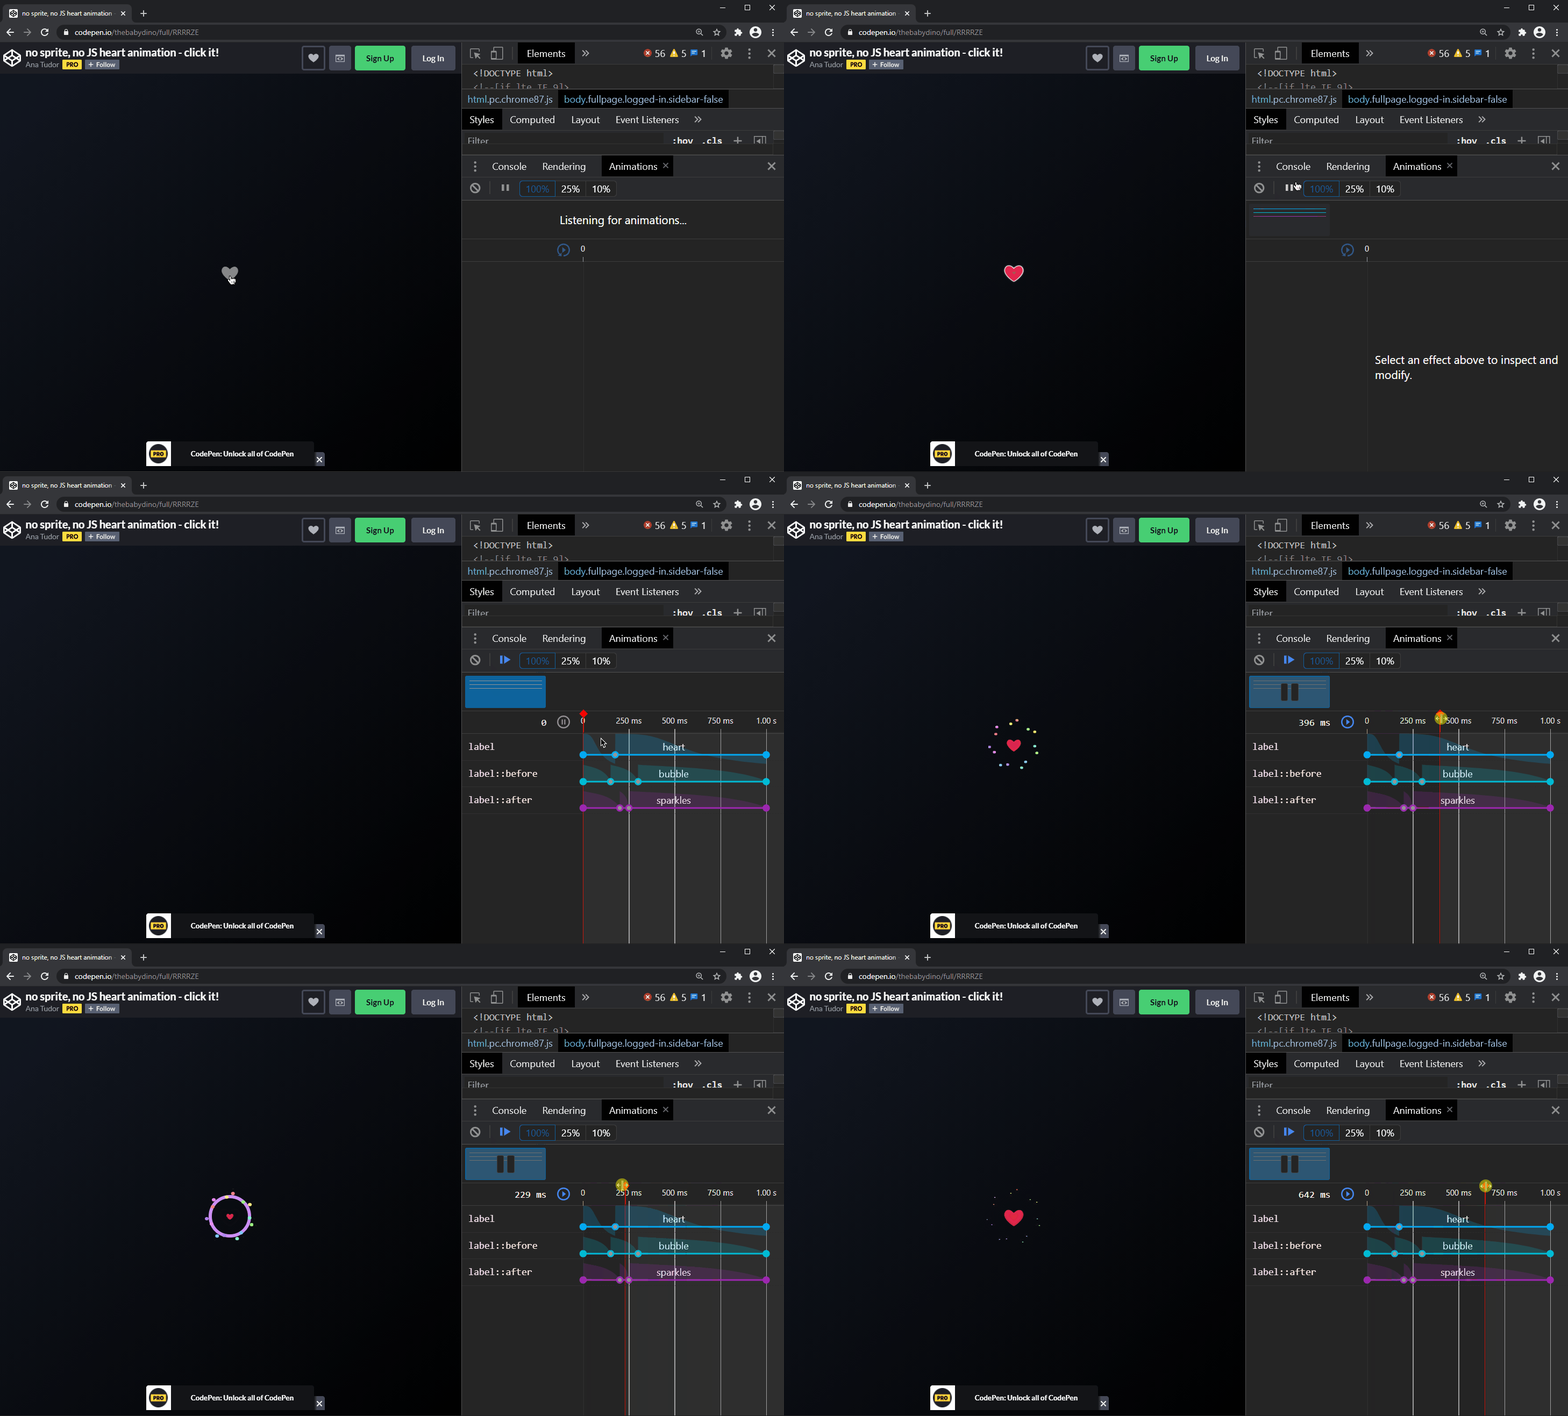
In the animations panel, you have access to a timeline of each animation frame happening on the page. It’s fully interactive, you can go back and forth, play, and pause in each frame.
Jump to headingCoverage
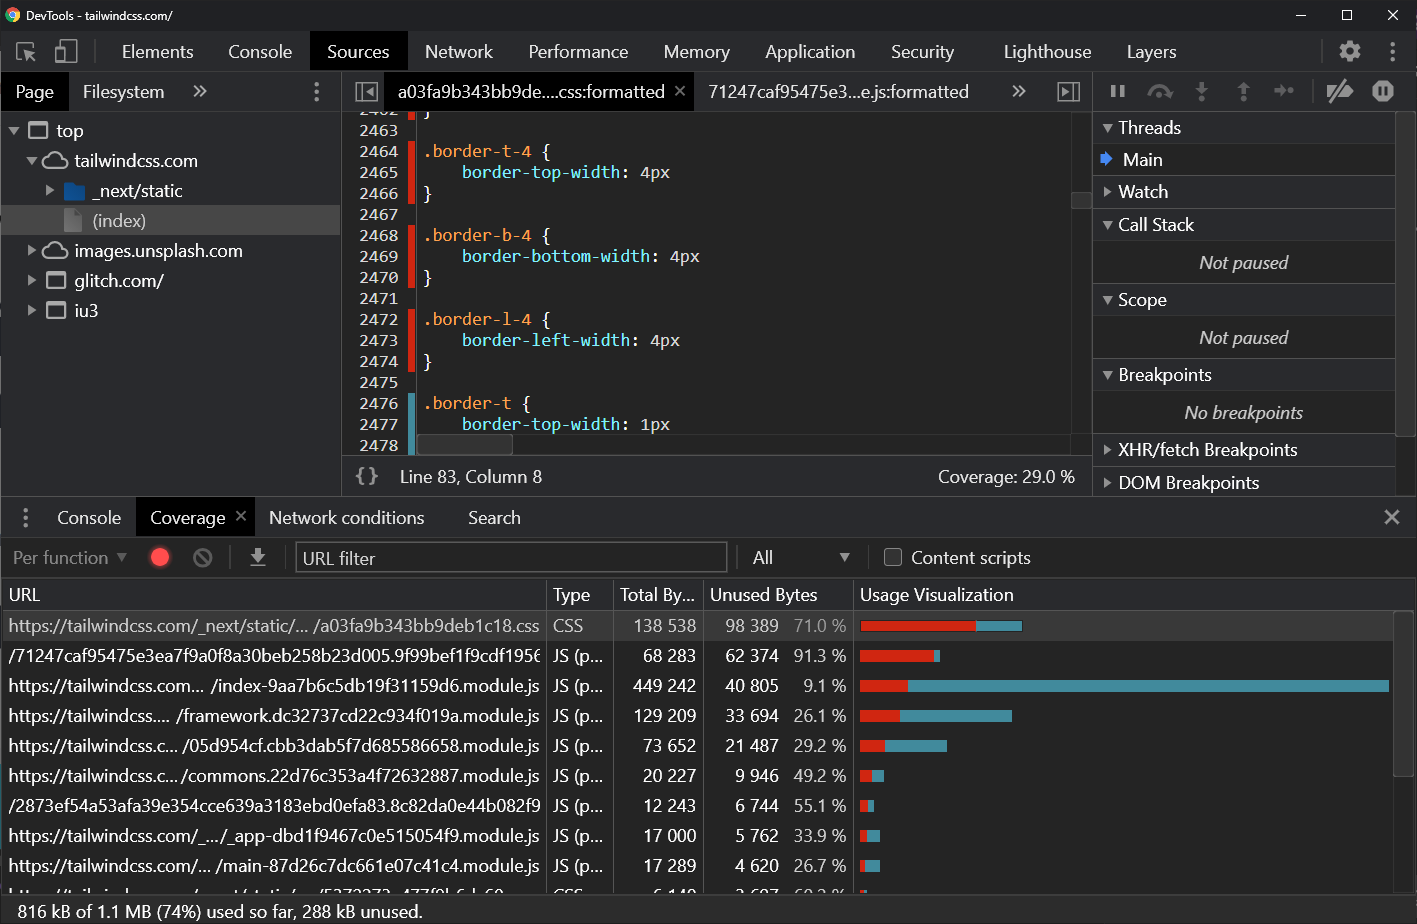
The Coverage tab allows us to find unused blocks of code in our application. Shipping lots of JS/CSS code can be a problem in web development if the user is downloading extra content.
Coverage shows a list of resources each containing how many bytes it has and how many of them are unused and you can actually open the file then the unused parts will be highlighted in red at the left.
Jump to headingNetwork Conditions
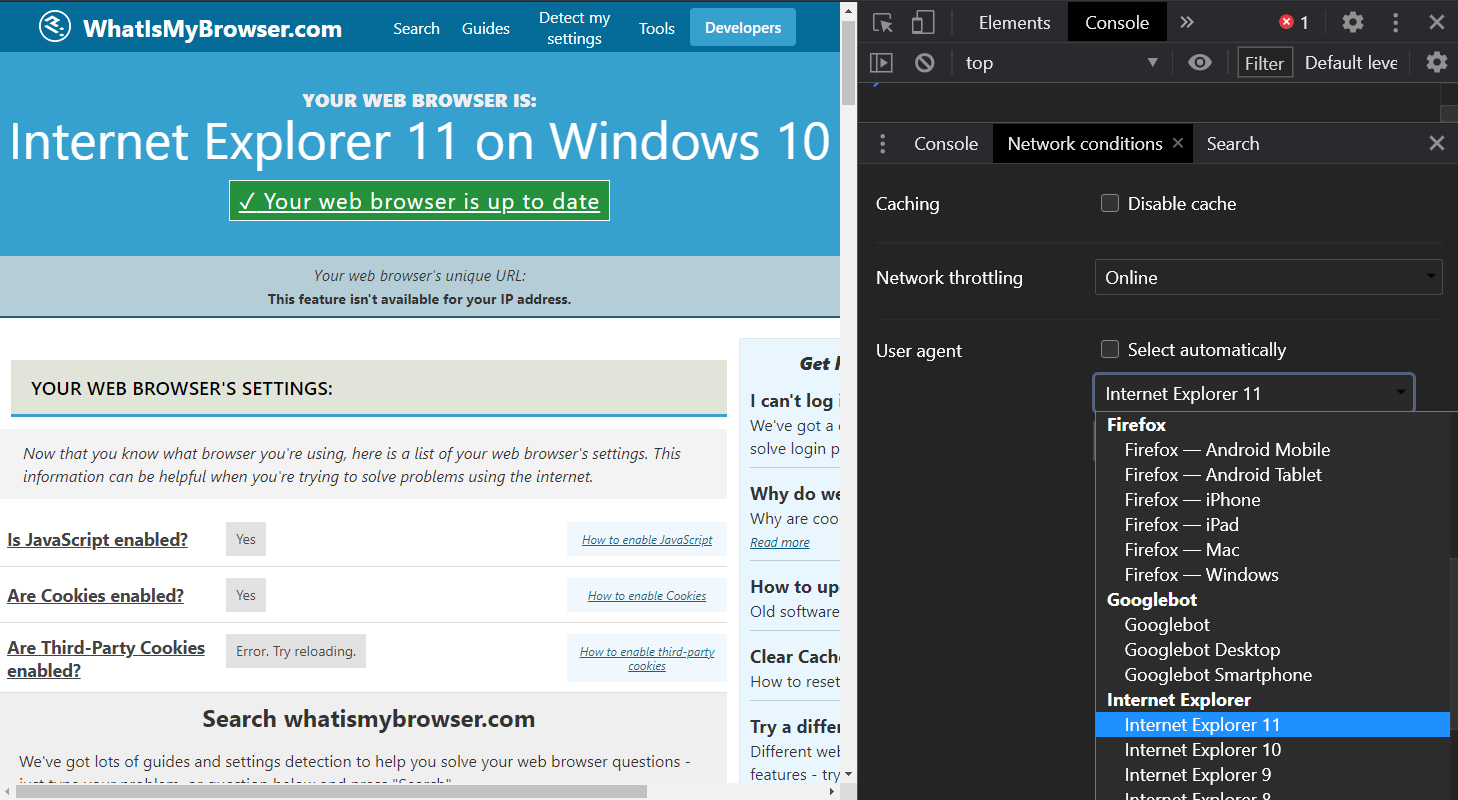
Network Conditions tab it’s very simple, you may notice that some of the features are the same presented in the Network tab, but it has one of the most useful features, User-Agent.
In DevTools now you can emulate a browser or device by disabling “Select automatically” the dropdown will now be enabled for you to select a different User-Agent like Firefox or Safari, or Chrome on Android, and so on. You can even create your custom User-Agent.
Note: This only works in your current website tab and while the DevTools is open
Jump to headingSearch
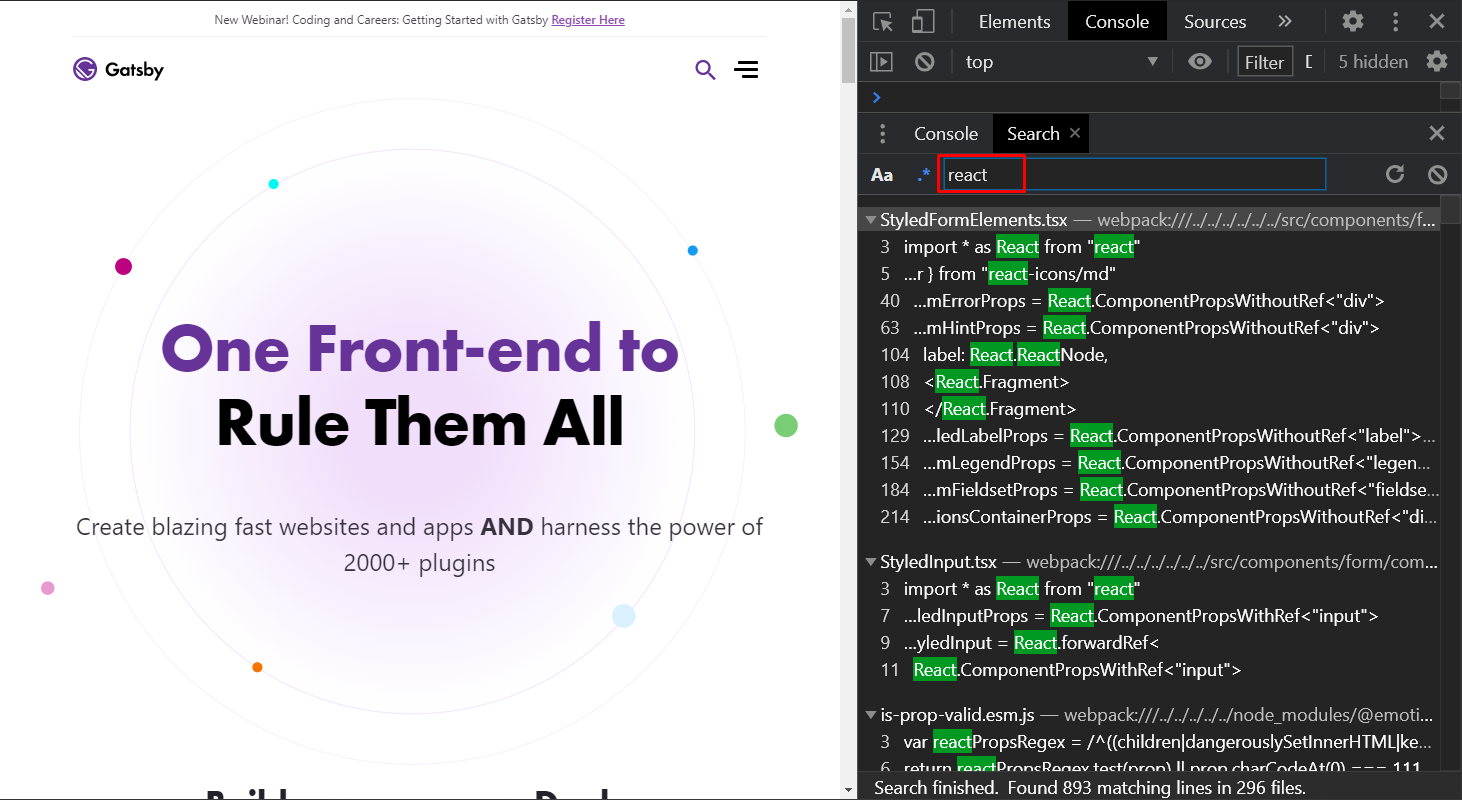
And finally, the search tab allows us to quickly search files by string or regex
Good to mention that even though these demos were captured on Chrome, you can experiment with the features in any Chromium-based browser as well.
I hope you found these features helpful, if you have some feedback or suggest please leave a comment in the section below. ✌
Jump to headingFurther Reading
Debugging JavaScript - Chrome DevTools 101
Chrome DevTools Performance Rendering